.
Introduction
The use of ascorbate in cancer remains an area of controversy. Currently, there are no clinical data that show the importance of several factors in the treatment schedule using high dose vitamin C, such as dose, frequency and duration of administration on the effectiveness of the cancer patients’ treatment (Carr & Cook, 2018).
Most practitioners administer IV ascorbate to cancer patients by bolus infusions 2-3 times per week (Padayatty et al., 2010). Bolus infusion of high dose ascorbate (1g/kg) can reach very high levels in blood based on the data of pharmacokinetics, but ascorbate is very quickly eliminated from the body with half life time about two hours (Riordan et al., 2000; Duconte et al., 2008). Such treatment is generally well tolerated and safe, with few adverse events reported, and there are supporting case reports of an anticancer effect of such a regimen (van Gorkom et al., 2019; Klimant et al., 2018; Fritz et al. 2014).
There have been two clinical trials that used continuous IVC infusions. Cameron and Pauling performed a clinical trial in 100 terminal cancer patients (Cameron & Campbell, 1974; Cameron & Pauling, 1976). The protocol included an initial 10 day course of IV ascorbate, at a relatively low daily dose of 10 g/day given by continuous infusions, followed by continuous oral intakes of 10-30 g/day, in divided doses. Their results showed increased survival time and improved the quality of life of the patients. According to the Cameron protocol’s recommendation: “Vitamin C intravenously can be given by intermittent injection, but this is not recommended, particularly if the intervals between injections extend to several days. Because of the rebound effect, such administration would produce a saw tooth plasma ascorbate profile with abnormally low levels in the troughs just prior to the next injection. We recommend continuous administration via slow drip infusion”.
The ideas of Linus Pauling were extended in the “The dynamic flow model” developed by Dr. Hickey [Hickey et al., 2005; Hickey & Roberts, 2013).
The second trial of the treatment of cancer patients by continuous infusions was conducted by Dr. Hugh Riordan. In a Phase I clinical trial of Dr. Riordan, patients were given continuous infusions using an infusion pump (Riordan et al., 2005). The study was conducted in 1998 and the first data analysis published in 2005 was focused on the safety of the treatment.
In this publication, we described previously unpublished parameters from the Riordan clinical study, including blood chemistry and blood count parameters that are reportedly related to patient prognosis and degree of inflammation. This included: absolute neutrophil and lymphocyte counts and the neutrophil-to-lymphocyte ratio; lactate dehydrogenase, an enzyme involved in tumor initiation, metastasis, and glucose, as hyperglycemia is common in cancer patients. The analysis demonstrated the regulatory effect of continuous IVC on neutrophil-to-lymphocyte ratios, lymphopenia, neutrophil count, lactate dehydrogenase and hyperglycemia.
Materials and Methods
A detailed description of how the Phase 1 IVC continuous infusion clinical trial was conducted was given previously (Riordan et al., 2005). A total of 24 patients with late stage cancer were included in our study. All patients had several rounds of chemotherapy or radiation prior to entering the study. 79% of the patients had a metastatic tumor. 17 patients had colon cancer with liver and lung metastasis, three patients had pancreatic or liver cancer and the rest of the patients had esophagus or rectal cancer. Patients were divided into five groups and treated by continuous infusion of 150 mg/kg/day (three patients), 290 mg/kg/day (seven patients), 430 mg/kg/day (six patients), 510 mg/kg/day (three patients) and 710 mg/kg/day (five patients). Sodium ascorbate was diluted in Lactated Ringers solution and infused by continuous infusion pump.
Blood cell counts, blood chemistry parameters, progression or disease, and adverse events were monitored in these patients. Samples were collected one week prior to therapy and at weekly intervals during intervention. White blood cell counts, hemoglobin and hematocrit, red blood cell counts, glucose, lactate dehydrogenase and blood chemistry parameters related to renal function (creatinine, BUN, and uric acid) were determined using standard procedures at the Eppley Institute for Research in Cancer and Allied Diseases at the University of Nebraska Medical Center (Riordan et al., 2005). Plasma ascorbate concentrations were measured as the Riordan Clinic laboratory by colorimetric method.
The clinical trial was approved by the ethics committee of the Eppley lnstitute for Research in Cancer and the Institutional Review Board of the Riordan Clinic. Written informed consent was obtained from all patients.
The data were analyzed by Systat software (Systat, Inc) and Kaleidagraph software. Statistical significance was evaluated by using a paired, two-tailed, Student’s t test where P< 0.05 was considered significant.
Results
1. Ascorbate concentrations in blood after continuous injections
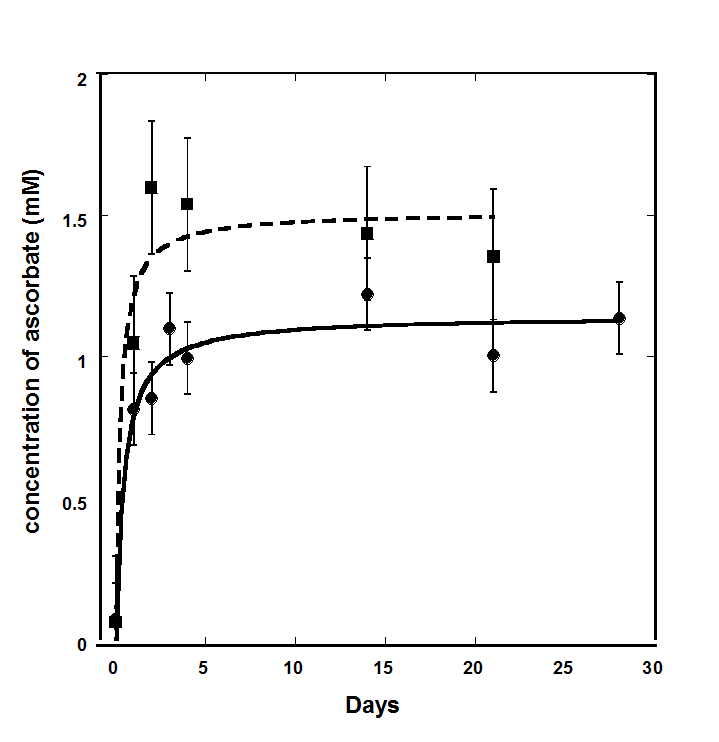
During the continuous infusion clinical trial, the levels of ascorbate were measured before intervention, every day for the first four days and then at the end of each week. Pre-treatment measurements demonstrated that patients had severe vitamin C deficiency (Riordan et al., 2005; Mikirova et al., 2019). Two thirds of the subjects had levels below the normal range (0.6mg/dL-2mg/dL), with the majority of them (47%) having levels undetectable by colorimetric assay. We should note that at this time the clinical laboratory used a colorimetric method for measurements of ascorbate, which was not very sensitive. During IVC treatment, ascorbate levels increased, and reached plateau, but average maximum values did not differ significantly and were in the range of 1.2 mM-1.5 mM. The mean plasma ascorbate level, at steady state, for the three subjects at the dose 150 mg/kg/day was 1.00 ± 0.34 (SD) mM. At higher dosages the average concentration during the IVC treatment reached 1.3 mM ± 1.4 mM for 290 mg/kg/day, 1.0 mM ± 0.5 mM for 570 mg/kg/day and 1.4 mM ± 0.8 for 710 mg/kg/day.
The leveling off of the ascorbate concentration at high doses of ascorbate can be explained by the saturation of renal tubular ascorbate reabsorption that leads to increased ascorbate excretion. The ascorbate concentrations in blood for low (150 mg/kg/day) and high (710 mg/kg/day) dosages, averaged for all patients in these dosage groups, are presented in Figure 1.
Figure 1. Time course of the average ascorbate concentrations in blood for continuous infusions with dosages 150 mg/kg/day (black circles) and 710 mg/kg/day (black squares). Data were extrapolated by Michaelis-Menten equation.

2. Effect of continuous infusion on absolute lymphocyte counts
As lymphocytes and neutrophils have important roles in tumorigenesis and carcinogenesis, we analyzed the effect of the treatment on these parameters. In chemotherapy, neutrophil and lymphocyte counts typically decrease, with the effect being more severe for lymphocytes.
The effect of continuous infusions on the absolute lymphocyte count (ALC) was analyzed for 22 patients from 24 terminally ill cancer patients. More than half of the patients enrolled in the study had lymphopenia or absolute lymphocyte counts less than 1300 cells/µl (normal range 1300-4000 cells/µl). The data of the patients’ diagnosis, lymphocyte and neutrophil counts one week before treatments, at the beginning and end of the treatment, and the duration and the dosages of the treatments are shown in Table 1.
Table 1. Characteristics of twenty-four cancer patients (diagnosis, duration/dosages of treatment, and pretreatment, initial and final lymphocyte and neutrophil counts) who participated in a phase I clinical trial of continuous IVC infusions.
| Dosage (mg/kg/d) | Diagnosis | Time
(weeks) |
ALC
pre |
ALC initial | ALC post | ANC initial | ANC post |
| 150 | Colon Cancer/ Liver Mets | 3 | 1230 | 980 | 1056 | 5180 | 7392 |
| 150 | Colon Cancer/ Liver Mets | 8 | – | 944 | 1751 | 9417 | 8443 |
| 150 | Colon Cancer/ Wall Mets | 7 | 2162 | 1168 | 1584 | 5480 | 5565 |
| 290 | Colon Cancer/ Liver Mets | 8 | – | 1261 | 755 | 7178 | 9887 |
| 290 | Colon Cancer/Liver Mets | 2 | 420 | 518 | 897 | 6052 | 5589 |
| 290 | Appendix/ Carcinomatosis | 7 | 1850 | 1494 | 3843 | 5199 | 7002 |
| 290 | Liver Cancer | 8 | – | 552 | 1035 | 5727 | 4913 |
| 290 | Colon Cancer/Liver Mets | 6 | 1045 | 1188 | 573 | 3896 | 4341 |
| 290 | Colon Cancer/ Omentum | 8 | 1170 | 902 | 2058 | 5924 | 6302 |
| 430 | Colon Cancer/Lung Mets | 7 | 2232 | 1971 | 1795 | 3988 | 5341 |
| 430 | Colon Cancer/Lung Mets | 3 | 1296 | 1560 | 1044 | 8748 | 9512 |
| 430 | Colon Cancer/Liver Mets | 8 | 1392 | 1170 | 1365 | 6218 | 7146 |
| 430 | Colon Cancer/Liver Mets | 8 | 4712 | 4712 | 7752 | 4826 | 5515 |
| 430 | Colon Cancer | 6 | 2048 | 2205 | 1610 | 3151 | 3165 |
| 430 | Pancreas Cancer | 8 | 266 | 245 | 299 | 2576 | 3767 |
| 430 | Rectal Cancer/ Liver, Lung Mets | 3 | 1178 | 1311 | 1605 | 4906 | 4051 |
| 570 | Colon Cancer/ Liver Mets | 8 | 1400 | 1590 | 1270 | 2934 | 3124 |
| 570 | Pancreas Cancer/ Liver Mets | 7 | 777 | 663 | 999 | 2969 | 5781 |
| 570 | Colon Cancer/Lung Mets | 8 | 1260 | 355 | 836 | 6048 | 5499 |
| 710 | Colon Cancer/Liver, Lung Mets | 8 | 1512 | 972 | 1055 | 5571 | 6100 |
| 710 | Colon Cancer/Liver, Lung Mets | 8 | – | 936 | 915 | 3432 | 4062 |
| 710 | Cholangiocarcinoma/Liver Mets | 0.3 | – | 2496* | – | 15600 | 9271 |
| 710 | Esophagus Cancer/Liver Mets | 1.5 | – | 663* | – | 3723 | 6424 |
| 710 | Colon Cancer/Liver Mets | 8 | 496 | 624 | 1075 | 8249 | 5470 |
* Excluded from the data analysis due to lack of post treatment data.
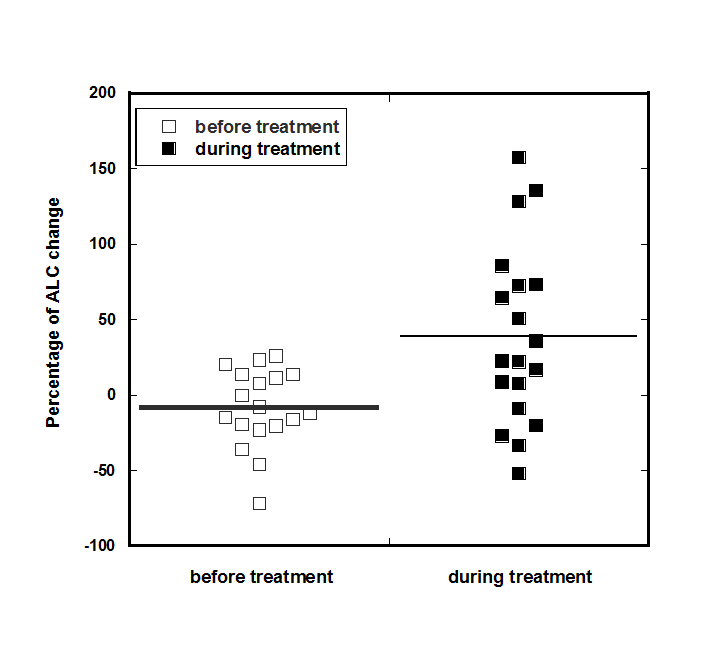
The percentage of change in ALC was calculated based on the pre-treatment ALC (6-12 days before intervention), initial ALC values and the ALC at the end of the treatment. According to our data, the tendency of ALC was to decrease in 56% of patients before treatment.
For patients with lymphopenia (15 subjects) the improvement or stabilization of the count was seen in all patients except for one subject. For this group of patients the median values of ALC was 940 cells/µl (IQR 588-1168 cells/µl) at the beginning of treatment and 1045 (IQR 866-1420 cells/µl) at the end of the treatment (p-value = 0.03). On average, there was a 22% of improvement in lymphocyte counts for all patients who completed 6-8 weeks of treatment and had ALC <1300 /µl (IQR: 89%, -24%). For five patients, the ALC values returned to the normal level (ALC>1300 cells/µl) and for five patients the values reached the level of 1000 cells/µl. Distribution of the ALC before and after treatment and percentage of ALC improvement for patients with initial ALC less than normal range and in normal range are shown in Figure 2.
Figure 2. Distributions of the percentage of change in absolute lymphocyte counts before and after treatment.
Severe lymphopenia (ALC<1000 cells/µl) was measured in 10 patients. Only six patients with severe lymphopenia completed 6-8 weeks of treatment. On average, for the six patients with the ALC <1000 cells/µl, there was a 69% improvement in the lymphocyte count at the end of the treatment (IQR: 129%, -6%).
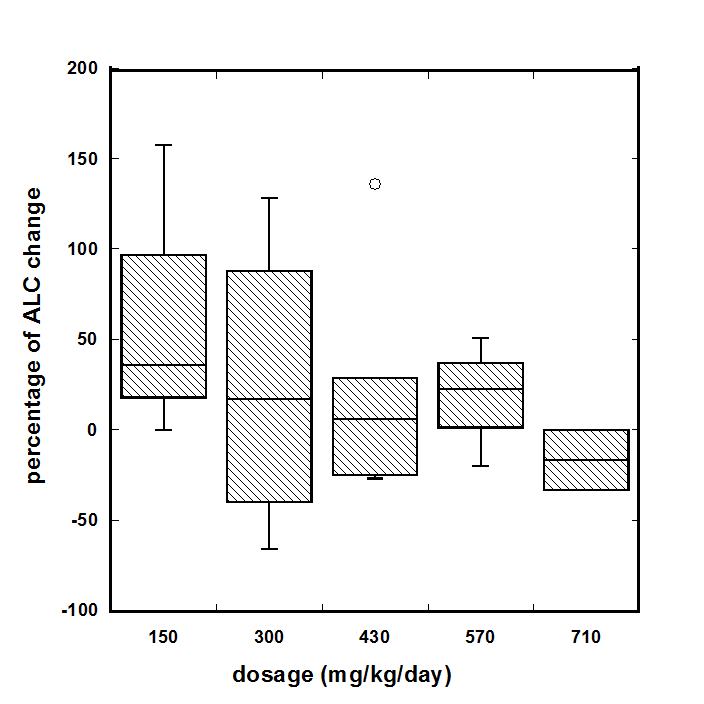
For all patients who completed 6-8 weeks of treatment (18 subjects), we analyzed the dosage effect of vitamin C on the improvement in lymphocyte counts. At the low doses of continuous infusions (combined 150 and 300 mg/kg/day) the median increase in lymphocyte counts was 35% (IQR (-11%÷107%), for high doses (430, 570, and 710 mg/kg/day) the median change in lymphocyte counts were, respectively, 6% (IQR: -22%÷28%), 22% (IQR: 1%÷36%) and -16% (IQR: -25%÷-8%). The dependence of the percentage of ALC change on dosage of continuous infusion is shown in Figure 3. These data indicate that lower doses are more favorable for the improvement of lymphocyte count.
Figure 3. The dosage effect of vitamin C on the change in lymphocyte counts.
3. The effect of continuous infusion on ANC and NLR
Absolute neutrophil counts (ANC) and neutrophil-to-lymphocyte (NLR) ratios are useful prognostic factors in a variety of cancers, with higher values of NLR indicating lower survival times (An et al., 2010).
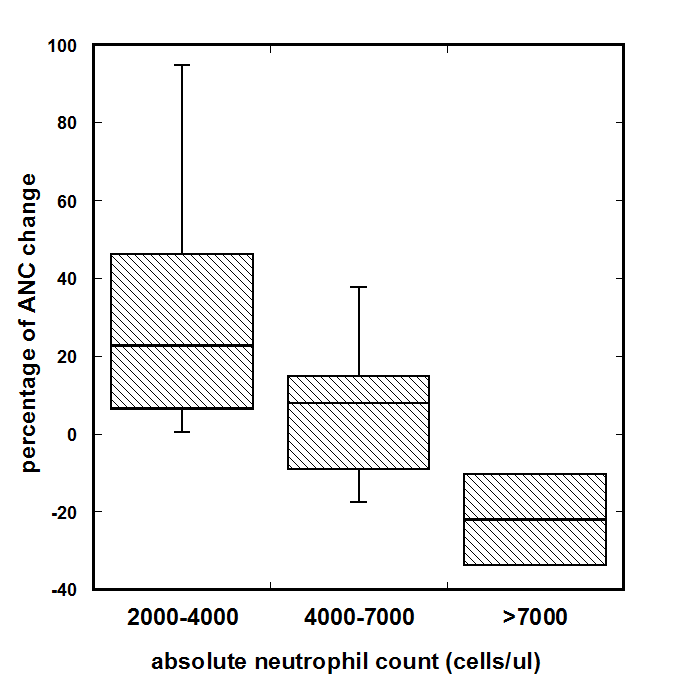
We analyzed the initial and final values of ANC for the patients treated by continuous infusion and who completed 6-8 weeks of treatment. The normal range for ANC is 2000-7000 cell/ul. During analysis the ANC values were divided in three ranges: the levels of ANC less than the middle of the NR (2000-4500cell/ul), higher than the middle of NR (4500-7000cells/ul) and higher than normal range. The distributions of the changes of ANC are shown in Figure 4.
Figure 4. Dependence of the ANC change on the initial cell counts for continuous treatment. The levels of ANC were divided to three regions: less than the middle of the normal range (2000-4500cell/µl, n=6), higher than the middle of normal range (4500-7000 cells/µl, n=10) and higher than normal range (ANC>7000 cells/µl, n=2).
4. The effect of continuous and intermittent infusions on NLR.
For continuous infusions we were able to calculate the tendency in the change of NLR before and during treatment as the values for ALC and ANC were measured a week before treatment, at the beginning, and each week during treatment.
The rate of change in this ratio (ΔNLR) for each patient before and after therapy was described in our previous article (Mikirova et al. 2019). To calculate the initial ΔNLR (prior to therapy), NLR on day zero was subtracted from NLR measured one week prior to therapy, and this difference was divided by the number of days between the two measurements.
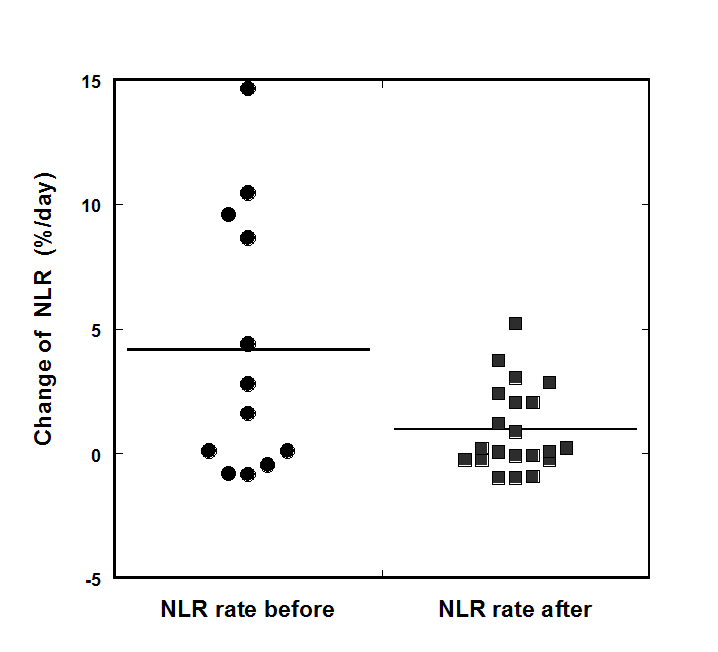
At the beginning of IVC therapy, 75 % of subjects had NLR levels higher than normal range (0.78-3.53). The improvement in the NLR was seen only in 36% of the patients. However, the comparison of the trend in the change of NLR measured for periods one week before treatment and during treatment demonstrated that the rate of change was decreased. The average ΔNLR values for the patients who completed 6-8 weeks of treatment were 4.2 %/day pre-therapy and 1.0 %/day post-therapy. The rate of NLR changes (percentage per day) before and after treatment for patients who completed 6-8 weeks of treatment is shown in Figure 5.
Figure 5. The rate of NLR changes (percentage per day) before and after treatment for patients who completed 6-8 weeks of treatment.
According to our data, the treatment resulted in the suppression or prevention of the progression of the rate of growth of NLR. This improvement of the rate of change of NLR was found for 54% of the patients. For patients with initial NLR higher than the upper level of the normal range of 3.5, improvement was seen in 64% of patients who completed 6-8 weeks of treatment.
These data show that continuous IVC can have a positive effect on the improvement of neutrophil count and neutrophil to lymphocyte ratio in cancer patients.
Our data also demonstrated the relationship between the survival of patients and the rate of growth of NLR (Mikirova et al., 2010). There was a statistically significant (p < 0.01) correlation between post-treatment ΔNLR and survival time, with high ΔNRL coinciding with lower survival times. This suggests that IVC may reduce NLR levels, thus improving prognosis.
5. Effect of continuous infusions on LDH and hyperglycemia
As activation of glycolytic metabolism is a significant characteristic of tumor cells, and lactate dehydrogenase is an important coenzyme in glycolysis, the effect of intervention of the level of LDH was analyzed. The elevated levels of serum LDH may be useful prognostic biomarkers of cancer patients’ survival.
The normal range for blood lactate dehydrogenase is between 140 U/L and 280 U/L. LDH concentrations before IVC therapy were above the normal range in 50% of the patients (LDH range 300 U/L-1790 U/L).
The rate of change of LDH was calculated before and after treatment. The value of this parameter (ΔLDH) was decreased in 38% of the patients, increased in 28.6% and was not changed in 33.4% of patients.
Survival times (days) of cancer patients with normal (LDH<245 U/L) or above normal range (LDH>245 U/L) LDH concentrations was compared in our previous publication [13]. The median survival time for the all participants with initial LDH higher than normal range (LDH>245 U/L) was 95 days. In contrast, the median survival time for all subjects with normal initial LDH values was 173 days (p = 0.097). The median survival time for the patients who were able to complete the 6-8 weeks of the study was 153 days for patients with initial LDH higher than normal range and 238 days for patients with initial LDH within the normal range.
Hyperglycemia is common in cancer patients. Two thirds of the patients in our study had above normal blood glucose concentrations. Percentage of plasma glucose concentration change during IVC therapy as function of pre-treatment glucose concentrations (mg/dL) shows the correlation between initial glucose concentration and the change in glucose levels during intervention (Mikirova et al., 2010). For all patients with increased level of glucose the concentration of glucose was decreased on -11% ÷ -45% during treatment, and glucose levels decreased most dramatically when the initial glucose concentrations were higher.
6. Safety and side effects of continuous infusions
Side effects and safety of continuous infusion were discussed in detail in the previous articles (Riordan et al. 2005; Mikirova et al., 2010). The most common minor side effects during continuous treatment were nausea (11 subjects), injector port occlusion (10 subjects), dry skin or mouth (7 subjects), edema (7 subjects) and fatigue (6 subjects).
Most of the Grade 3 events involved hypokalemia. Three subjects experienced a Grade 3 decrease in blood potassium (K) level and one subject had Grade 2 while being treated with 430-710 mg/kg/day ascorbate. Grade 2 or 3 hypokalemia was only an issue at the three highest doses tested. These patients saw their potassium level decrease by a quarter or a third during the study. Another serious side effect during continuous IVC treatment was development of a kidney stone after thirteen days of treatment at the dosage of 290 mg/kg/day ascorbate by one subject who had a prior history of kidney stones (Riordan et al., 2005).
The analysis of the occurrence of adverse events by IVC dosage showed that there are fewer side effects at the lowest dose (Mikirova et al., 2010). In an attempt to quantify this, the total grades per subject were computed at each dose. The results show a trend of more adverse events at higher doses. Grade 2 or 3 hypokalemia was only an issue at the three highest doses tested. Edema was also more frequent in high dosage infusions. While the highest dose is still safe, the pharmacokinetic data of continuous IVC indicate that the plasma ascorbate concentrations do not increase very much as the dose is increased, so the better strategy may be to use lower doses with longer administration.
Discussion
Vitamin C contributes to immune defense by supporting various cellular functions of both the innate and adaptive immune system (de Grooth et al., 2018). The role of vitamin C in leukocyte function and its multiple beneficial effects on immune function was summarized in the review (Carr & Maggini, 2017). In the present study we compared the effect of continuous infusions and intermittent high dose bolus IVC injections on two immune cell population functioning.
In the Riordan Clinic trial, patients were treated by continuous infusion, which was administered over much longer periods of time than bolus intermittent treatments. For most patients the duration of the continuous infusion was at least 20 hours and the duration of bolus infusion is from one hour to three hours depending on the dosages.
The present analysis demonstrated the regulatory effect of continuous IVC on lymphopenia, neutrophil-to-lymphocyte ratios, and absolute neutrophil counts.
However, the literature search of the improvement of lymphopenia in cancer patients by IVC treatment resulted in one study (Rodríguez et al., 2017), which demonstrated positive effect of low dose IVCs on ALC. In this study 48 cancer patients were treated by iv 7.5 grams of ascorbate one time per week. After four weeks ALC increased by a mean of 211/μL (p = 0.0018). For patients with severe lymphopenia (n = 25) (ALC <1000/μL), the increase in ALC was greater than in patients with an initial ALC of 1000–1500. This study may indicate that intermittent small dosage IVC are beneficial for immune cells.
Our data also suggested a strategic benefit of using lower IVC doses in continuous infusions for improvement immune functioning, as raising the dose above 20 grams/70kg body weight increased the frequency of side effects and showed a tendency to decrease improvement in lymphocyte counts. Side effects and safety of continuous infusions were discussed in detail in the previous articles (Riordan et al., 2005; Mikirova et al. 2019).
Most practitioners administer IV ascorbate to cancer patients by bolus infusions of pharmacological doses of ascorbate several times per week (Padayatty et al. 2010). According to present hypothesis, pharmacological bolus dosages of 50-100 grams have an anti-cancer effect by increasing hydrogen peroxide in the tumor environment.
However, ascorbic acid has multifunctional mechanism of actions. In addition to the proposed mechanism of the pro-oxidant effect of high dose ascorbate, studies have demonstrated that the mechanisms of anti-tumor activity of ascorbate are multifactorial and include changes in the metabolic activity, stimulation of the 2-oxoglutarate dependent dioxygenase family of enzymes, which regulate the hypoxic response and collagen stabilization, and the epigenetic histone and DNA demethylation (Dua et al. 2012; Young et al. 2015).
There are studies supporting the anti-tumor effect of relatively lower concentrations of vitamin C than pharmacological doses given by bolus IVC. For example, ascorbate can inhibit hypoxia-inducible factor-1 (HIF-1) activation in vitro at intracellular concentrations between 150 and 300 µM (Kuiper et al., 2014), and pharmacokinetic data on ascorbate in tumor tissues following vitamin C administration determined an optimal dose for HIF-hydroxylase activity of ~1–3 mM (Myllyla et al., 1978).
The in vitro study of the optimal concentration of ascorbate as a cofactor for hydroxylases that regulate gene transcription and cell signaling pathways shows that ascorbate concentration less than 1,000uM dose-dependently increases the 5-hmC signal (Minor et al., 2013).
Frequency of the treatment has an effect on mechanisms of tumor suppression. Campbell et al. examined the effects of treatment schedule on the ability of intravenous ascorbate to inhibit HIF-1 expression (and the expression of its target proteins) in tumor bearing mice. As it was found, a single bolus injection inhibited expression temporarily while daily injections maintained the inhibition. Increased tumor ascorbate was associated with slowed tumor growth, but alternate day administration of ascorbate resulted in lower tumor inhibition and did not consistently decrease HIF-1 pathway activity (Campbell et al., 2016).
Our retrospective analysis of prostate cancer patients treated with bolus IVC at the Riordan Clinic (1994-2015) showed that PSA levels increased more slowly in subjects given more frequent IVC treatments (Mikirova & Hunninghake, 2017).
The philosophy of maximum tolerated doses is now reevaluated in the treatment by chemotherapeutic regimens, which show large intermittent doses often being more toxic and less effective than smaller repeated doses. Metronomic chemotherapy proved to be effective in clinical trials in terms of survival prolongation. Particularly in the case of solid tumors, maximum tolerated dose chemotherapy kills off chemotherapy-sensitive cancer cell populations, leaving chemo resistant cells behind to re-colonize the tumor, ultimately leading to disease relapse (Kim & Tannock, 2005). In addition, recent advances in tumor biology point away from focusing on the cytotoxicity of drugs and focus on the modification of the tumor biology by targeting the tumor microenvironment (Mbeunkui & Johann Jr., 2009).
Conclusions
In conclusion, continuous low dose IVC infusions exhibited beneficial effect for cancer patients with respect to normalizing leukocyte counts, indicating an improvement in both the innate and adaptive immune systems. Our study demonstrated the regulatory effect of continuous IVC on lactate dehydrogenase, neutrophil-to-lymphocyte ratios, lymphopenia, neutrophil count and hyperglycemia. Further research in this area and clinical studies of the efficacy of continuous intravenous vitamin C infusions are warranted.
Funding
This research received no external funding.
Acknowledgments
The author wishes to thank Prof. Anitra Carr for her helpful comments and for editing the manuscript.
Conflicts of Interest
The author declares no conflict of interest.
References
An X, Ding PR, Wang FH, Jiang WQ, Li YH (2010) Elevated neutrophil to lymphocyte ratio predicts survival in advanced pancreatic cancer. Biomarkers. 15(6): 516-522. https://doi.org/10.3109/1354750x.2010.491557
Cameron E, Campbell A (1974) The orthomolecular treatment of cancer II: Clinical trial of high-dose ascorbic acid supplements in advanced human cancer. Chem Biol Interact. 9(4): 285-315. https://doi.org/10.1016/0009-2797(74)90019-2
Cameron E, Pauling L (1976) Supplemental Ascorbate in the Supportive Treatment of Cancer: Prolongation of Survival Times in Terminal Human Cancer. Proceedings of the National Academy Sciences of the United States of America. 73(10): 3685-3689. https://doi.org/10.1073/pnas.73.10.3685
Campbell EJ. Vissers MCM, Wohlrab C. Kevin O. Hicks KO, Strother RM, Stephanie M. Bozonet SM, Robinson BA, Dachs GU (2016) Pharmacokinetic and anti-cancer properties of high dose ascorbate in solid tumours of ascorbate-dependent mice. Free Radical Biology and Medicine. 99: 451-462. https://doi.org/10.1016/j.freeradbiomed.2016.08.027
Carr AC, Maggini S. (2017) Vitamin C and Immune Function. Nutrients. 9(11): 1211. https://dx.doi.org/10.3390%2Fnu9111211
Carr AC, Cook J (2018) Intravenous Vitamin C for Cancer Therapy – Identifying the Current Gaps in Our Knowledge. Physiol. 9:1182. https://doi.org/10.3389/fphys.2018.01182
de Grooth HJ, Manubulu-Choo WP, Zandvliet AZ, Spoelstra – de Man AME, Armand R. Girbes AR et al. (2018) Vitamin C Pharmacokinetics in Critically Ill Patients A Randomized Trial of Four IV Regimens. CHEST. 153(6):1368-1377. https://doi.org/10.1016/j.chest.2018.02.025
Dua J, Cullena JJ, Buettnera GR (2012) Ascorbic acid: Chemistry, biology and the treatment of cancer. Biochim Biophys Acta. 1826(2):443-457. https://doi.org/10.1016/j.bbcan.2012.06.003
Duconte J, Miranda-Massari JR, Gonzalez MJ, Jackson JA, Riordan NH (2008) Pharmacokinetics of Vitamin C: insights into the oral and intravenous administration of ascorbate. PRHSJ. 27(1): 7-19. PMID: 18450228 https://pubmed.ncbi.nlm.nih.gov/18450228/
Fritz H, Flower G, Weeks L, Cooley K, Callachan M, McGowan J, Skidmore B, Kirchner L, Seely D (2014) Intravenous Vitamin C and Cancer: A Systematic Review. Integrative cancer therapies. 13(4): 280-300. https://doi.org/10.1177/1534735414534463
Hickey DS, Roberts HJ, Cathcart RF (2005) Dynamic Flow: A New Model for Ascorbate Journal of Orthomolecular Medicine. 20(4).
Hickey DS, Roberts HJ (2013) Vitamin C and Cancer: Is There A Use For Oral Vitamin C? Journal of Orthomolecular Medicine. 28(1)
Kim JJ, Tannock IF (2005) Repopulation of cancer cells during therapy: an important cause of treatment failure. Nature reviews: Cancer. 5(&): 516-525. https://doi.org/10.1038/nrc1650
Klimant E, Wright H, Rubin D, Seely D, Markman M (2018) Intravenous vitamin C in the supportive care of cancer patients: a review and rational approach. Current oncology. 25(2): 139-148. https://doi.org/10.3747/co.25.3790
Kuiper C, Dachs GU, Munn D, Currie MJ, Robinson BA, Pearson JF, Vissers MCM. (2014) Increased tumor ascorbate is associated with extended disease-free survival and decreased hypoxia-inducible factor-1 activation in human colorectal cancer. Front Oncol. 4(10). https://doi.org/10.3389/fonc.2014.00010
Mbeunkui F, Johann Jr. DJ. (2009) Cancer and the tumor microenvironment: A review of an essential relationship. Cancer Chemother Pharmacol. 63(4): 571-582. https://doi.org/10.1007/s00280-008-0881-9
Mikirova N, Casciari J, Hunninghake R (2019) Continuous intravenous vitamin C in the cancer treatment: re-evaluation of a Phase I clinical study. Functional Foods in Health and Disease. 9(3). https://doi.org/10.31989/ffhd.v9i3.590
Mikirova N, Hunninghake R (2017) Changes in the rate of PSA progression and the level of alkaline phosphatase during high dose vitamin C treatment of patients with prostate cancer. Functional Foods in Health and Disease. 7(7). https://doi.org/10.31989/ffhd.v7i7.360
Minor EA, Court BL, Juan I. Young JI, Wang G (2013) Ascorbate induces ten-eleven translocation (Tet) methylcytosine dioxygenase-mediated generation of 5-hydroxymethylcytosine. J Bio Chem. 288(19): 13669-13674. https://doi.org/10.1074/jbc.c113.464800
Myllyla R, Kuutti-Savolainen ER, Kivirikko KI (1978) The role of a ascorbate in the prolyl hydroxylase reaction. Biochem Biophys Res Commun. 83(2): 441-448. https://doi.org/10.1016/0006-291x(78)91010-0
Padayatty SJ, Sun AY, Chen Q, Espey MG, Drisko J, Levine M (2010) Vitamin C: Intravenous use by complementary and alternative medicine practitioners and adverse effects. PLoS One. 5(7): e11414. https://doi.org/10.1371/journal.pone.0011414
Riordan NH, Riordan HD, Casciari JP (2000) Clinical and Experimental Experiences with Intravenous Vitamin C. Journal of Orthomolecular Medicine. 15(4).
Riordan HD, Casciari JJ, Gonzalez MJ, Riordan NH, Miranda-Massari JR, Taylor P, Jackson JA (2005) A pilot clinical study of continuous intravenous ascorbate in terminal cancer patients. P R Health Sci J. 24(4): 269-276. PMID: 1657523 https://pubmed.ncbi.nlm.nih.gov/16570523/
Rodríguez DM, Guerrero ME, Maldonado BM, Vollbracht C, Herrera SA (2017) Total lymphocyte count in cancer patients with lymphopenia treated with intravenous vitamin C: Results of an observational study. Translational Medicine Communications. 2(3). https://doi.org/10.1186/s41231-017-0012-x
van Gorkom GN,Y Lookermans EL, Van Elssen C,. Bos GMJ (2019) The Effect of Vitamin C (Ascorbic Acid) in the Treatment of Patients with Cancer: A Systematic Review. Nutrients. 11(5): 977. https://doi.org/10.3390/nu11050977
Young JI, Züchner S, Wang G (2015) Regulation of the Epigenome by Vitamin C. Annu Rev Nutr. 17(35): 545-564. https://doi.org/10.1146/annurev-nutr-071714-034228