Abbreviations
IVC: intravenous vitamin C; LDH: lactate dehydrogenase; ALC: absolute lymphocyte counts; NLR: neutrophil to lymphocyte ratio; IN/WBC: the ratio of immature neutrophils to white blood cells; AA: ascorbic acid; DHA: dehydroascorbic acid; A:G: albumin to globulin ratio; UA: uric acid.
Introduction
Colorectal cancer is a major worldwide health problem that, despite recent improvements in treatment, continues to have a low response rate (Allen et al., 2006). It is a heterogeneous disease: roughly forty percent of cases carry a KRAS oncogene mutation and roughly ten percent are characterized by BRAF oncogene mutation (Tan et al., 2012). The former is associated with poor outcomes, poor overall survival, serious alterations in normal cell metabolism and resistance to chemotherapy (Lievre et al., 2006).
Intravenous ascorbic acid (AA) administration is being considered as a potential treatment for cancer (Halabi et al., 2018). Pharmacological concentrations of AA induce antiproliferative, cytotoxic and genotoxic effects on colon cancer cells in vitro and induces cell death by oxidative stress and other mechanisms (Pires et al., 2016). Tumors preferentially accumulate ascorbate, possibly by uptake via glucose transporters and possibly by increased expression of AA transporters. Increased GLUT-1 transporter expression in mutated colon cancer cells leads to the accumulation of the oxidized form of AA, dehydroascorbate (DHA), which, in turn, is reduced back to AA (Yun et al., 2015). Once AA enters cells, it releases electrons necessary for the generation of superoxide radical, H2O2, and other reactive oxygen species (ROS). In two colon cancer cell lines, millimolar concentrations of AA led to downregulation of specificity protein (Sp) transcription factors Sp1, Sp3 and Sp4, along with Sp-regulated genes (Pathi et al., 2011). This, in turn, was accompanied by decreased cell proliferation, apoptosis, necrosis, and suppression of Sp-regulated genes involved in cancer proliferation and angiogenesis [hepatocyte growth factor receptor (c-Met), epidermal growth factor receptor (EGFR) and cyclin D1], survival (survivin and bcl-2), vascular endothelial growth factor (VEGF) , receptors (VEGFR1 and VEGFR2)]. These results correlate with studies demonstrating pro-oxidant activity of ascorbic acid and identification of hydrogen peroxide in extracellular fluid of mice administered pharmacologic doses of ascorbic acid (Chen et al., 2005; Duarte et al., 2007).
Ascorbate may also interfere with glucose metabolism in colon cancer cells, which rely heavily on the Warburg effect to meet cellular energy needs, by blocking essential enzymes or shutting down the pathway that allows KRAS mutation-dependent enhancement of glucose absorption (Halabi et al., 2018). In colon cancer cells, KRAS and BRAF mutations lead to activation via phosphorylation of the MAPK/ERK (Mitogen-Activated Protein Kinases/Extracellular Signal-Regulated Kinases) pathway. This, in turn, activates transcription factors and gene expression, promoting cell proliferation and survival. Thus, mutant KRAS is involved in the upregulation of the Warburg effect in colon cancer cells. Ascorbate may disrupt this metabolic upregulation, either by targeting GAPDH (Glyceraldehyde-3-Phosphate Dehydrogenase) (Yun et al., 2015) or by downregulating key metabolic checkpoints (Aguilera et al., 2016). Specifically, AA has been found to induce RAS protein detachment from the cell membrane, inhibiting extracellular signal related kinases (ERK) and pyruvate kinase M2 (PKM2) phosphorylation. This, in turn, leads to downregulation of GLUT-1 (glucose transporter) and PKM2-dependent protein expression, blocking the Warburg effect and inducing energetic stress in the cell.
Other potential mechanisms of action for AA against colon cancer include upregulation of p53 (An et al., 2012) and inhibition of hyaluronidase, an enzyme that aids tumor metastasis by destroying collagen (Shi, 2007). AA has been shown to induce apoptosis in colon cancer cells via increased calcium influx in the endoplasmic reticulum combined with translocation of the Bcl-2 protein family to the mitochondria and increase in Bax protein expression (Kim et al., 2012). Ascorbate is associated with the “normalization” of methylation markers TET (Duerte et al., 2007) and 5-hmCyt (Minor et al., 2013), and with decreases in hypoxia inducible factor (HIF-1)-activated tumor growth (Kuiper et al., 2014).
In summary, ascorbic acid, at pharmacological concentrations, exerts a selectively cytotoxic effect toward tumors, by several potential mechanisms of action.
At the clinical level, AA is associated with improvement quality-of-life in patients with advanced disease and improved tolerability of standard therapy (Halabi et al., 2018). Its benefits were found only when administered intravenously in high and frequent doses. A limited number of clinical studies are available to date. Further studies are needed on a larger scale to examine the therapeutic benefits of AA in colon cancer. In the present publication, we described previously unpublished parameters from the clinical study (Riordan et al., 2005) of the treatment of colon cancer patients by continuous ascorbate infusions, including blood chemistry and blood count parameters that are reportedly related to patient prognosis and degree of inflammation.
Patient characteristics
Seventeen patients with late stage colon cancer were included in our study. 88% of the patients had metastatic tumor. Written informed consent was provided by all patients included in this study. The ethics committees of the Eppley institute for Research in Cancer and Allied Diseases at the University of Nebraska Medical Center (Omaha. NE) and the IRB of the Riordan Clinic approved the study.
All patients had several chemotherapies, alone or with radiations before entering to the study. Prior chemotherapies included 5-FU, Mitomycin, Vincristine and the Theratope vaccine, among others. A description of all recruited 24 patients and how the Phase 1 IVC continuous infusion clinical trial was conducted was given previously (Mikirova et al., 2019). As 70 % of the patients in this study were patients with colon cancer, we decided to analyze this group separately.
For these subjects, information about the type of cancer, metastatic state, dosage during treatment, duration of the treatment, survival and adverse effects during intervention are presented in Table 1.
Table 1. Characteristics of colon cancer patients participating in a phase I clinical trial of continuous IVC infusions.
| Subject.. | Sex….. | Primary / Metastasis…… | AA Dose mg/kg/day… | Treatment… Time (weeks) | Survival… Time (days) | Adverse effects |
| 1 | m | Colon / Liver | 150 | 4 | 69 | ED |
| 2 | f | Colon / Liver, Lung | 710 | 8 | 456 | none |
| 3 | f | Colon / Liver | 290 | 8 | 143 | DM, NA,F |
| 4 | m | Colon / Lung, Liver | 570 | 8 | 397 | none |
| 5 | f | Colon / Lung | 430 | 7 | 155 | ED, DM |
| 6 | m | Colon / Liver | 290 | 2 | 36 | KS, DM |
| 7 | f | Colon / Lung | 430 | 3 | 21 | ED |
| 8 | m | Colon / Liver | 430 | 8 | 80 | none |
| 9 | f | Colon / Liver | 150 | 8 | 67 | NA |
| 10 | m | Colon / Liver | 430 | 48 | 334 | SD☼, NA, K |
| 11 | f | Colon | 430 | 6 | ND | NA |
| 12 | m | Colon / Liver, Lung | 710 | 8 | 43 | F, K |
| 13 | m | Colon / Chest-Abd. Wall | 150 | 7 | 220 | DM |
| 14 | f | Colon / Liver | 290 | 6 | 142 | none |
| 15 | m | Colon / Lung | 570 | 8 | ND | ED, BP |
| 16 | m | Colon / Liver | 710 | 8 | 110 | IWB |
| 17 | m | Colon / Omentum | 290 | 8 | 173 | AX |
The abbreviations of the side effects presented in the Table 1 are: SD☼ = Stable Disease, IWB = improved well-being, ED – edema, DM – dry mouth, NA- nausea, BP –blood pressure, AX- anorexia, KS –kidney stones and K-hypokalemia. ND- not determined.
The most common side effects were nausea, dry skin or mouth, edema and fatigue. These were generally minor. Two patients developed hypokalemia. Nowadays, it is recommended to monitor potassium levels during treatment and, if necessary, give oral potassium supplements. One patient developed a kidney stone after thirteen days of treatment at 290 mg/kg/day ascorbate. This subject had a prior history of kidney stones.
Intervention
Patients were divided into groups and given continuous AA infusions at specified doses: 150 mg/kg/day (3 patients), 290 mg/kg/day (4 patients), 430 mg/kg/day (5 patients), 510 mg/kg/day (2 patients) and 710 mg/kg/day (3 patients). Overall, fourteen of the patients received the treatment for at least six weeks. Subject 10, a male with colon and liver metastasis who was treated with 430 mg/kg/day ascorbate, showed stable disease (no increase in size of pre-existing lesions and no new lesions) and elected to continue ascorbate therapy for an additional forty-eight weeks.
To administer treatment, ascorbate was diluted in Lactated Ringers solution and administered continuously with a Travenol infuser (Pharmacic Deltac, St. Paul, MN) and a Cad-5400 or Sabratek 6060 infusion pump. Flow rates were set to 20 ml/hr. or 10 ml/hr., depending on the dose. Patients’ health, adverse events and tumor progression were monitored during treatment. Samples for routine blood chemistry were collected one week prior to therapy and roughly weekly intervals during treatment. The concentration of ascorbic acid in blood was measured before treatment, the first four days and at the end of each week of treatment.
Statistical analysis
The inter-relationship between survival and blood parameters was examined using Spearman’s correlation coefficients and regression analysis. Correlations were classified as “weak” for correlation coefficient values below 0.500, and “strong” for values exceeding 0.800. Pairwise comparisons were analyzed by Wilcoxon Signed –Rank test. Missing data were excluded from analysis on a variable by variable basis. Two tailed p values < 0.05 were considered statistically significant. Statistical analysis was performed using Systat software (Version 13. Chicago, IL, USA).
Results
Plasma ascorbate concentration
Pre-treatment plasma ascorbate concentrations were below normal in two thirds of the subjects, consistent with previous reports of cancer patients being generally deficient in this vitamin. Kinetic curves of ascorbate concentrations in blood during 21-28 days in the range of doses from lowest 150 mg/kg/day (approximately 10 grams per day) to highest 710 mg/kg/day (approximately 50 g per day), averaged for all patients in these dosage groups, are presented in Figure 1. Plasma AA concentrations increased initially (over a period of one to four days) and then appeared to reach of steady state of between 1.0 and 1.6 mM. Concentrations in this range are consistent with what are thought to be necessary for anti-cancer effect (Dua et al., 2012).
Increasing dosages did not have a dramatic effect on the steady state ascorbate concentrations. The mean values for subjects given 150, 290, 570, or 710 mg/kg/day were 1.08 ± 0.02(SD), 0.80 mM ± 0.30 mM, 1.30 mM ± 0.20 mM, and 1.40 mM ± 0.23, respectively.
In fact, the data for all four doses could be fit to a single Michaelis-Menten type equation with a calculated maximum level of 1.19 mM and a half-time to maximum of 0.87 days (r = 0.75). From day four onward, plasma ascorbate values ranged from 0.94 mM to 1.55 mM, indicating high patient-to-patient variability in ascorbate pharmacokinetic parameters.
Figure 1. Average ascorbic acid concentrations (mM) for doses of 150 mg/kg, 290 mg/kg, 570 mg/kg, and 710 mg/kg plotted against time.
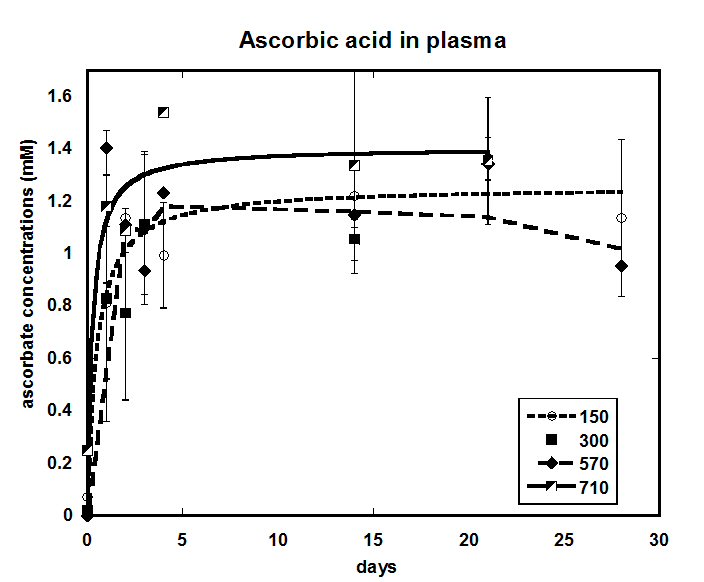
The noticed low increase of the achieved concentrations of ascorbate in plasma on infused dosage may be explained that such high doses will saturate the tubular ascorbate reabsorption and the sodium-dependent transporters, so the body excretes ascorbate more rapidly. Nonlinear renal clearance can in part to be responsible to produce such effect in plasma.
Survival time and blood parameters
Table 2 shows how various blood count and chemistry parameters measured prior to intravenous vitamin C therapy (IVC) correlate with patient survival time. In particular, we examined absolute lymphocyte count (ALC),neutrophil to lymphocyte ratio (NLR), lactate dehydrogenase concentration (LDH), glucose concentration, ratio of immature neutrophils to total white blood cells (IN/WBC), albumin concentration, albumin to globulin ration (A:G), and creatinine concentration, as these parameters are thought to be indicators of prognosis in colon cancer patients. The Spearman correlation coefficients between all these values are shown in Table 2.
Table 2. Spearman correlation matrix between measured blood parameters and survival of the patients. Spearman correlation coefficients between patient survival time and various blood parameters measured in colon cancer patients prior to treatment are indicated. Blood parameters are: absolute lymphocyte count (ALC), neutrophil to lymphocyte ratio (NLR), lactate dehydrogenase concentration (LDH), glucose concentration, ratio of immature neutrophils to total white blood cells (IN/WBC), creatinine concentration, uric acid concentration, albumin to globulin ratio (A:G RATIO), and albumin. Strong and moderate correlations, as defined in Methods, are indicated in bold type.
| Survival…… | ALC…… | NLR…… | LDH…… | Glucose… | IN/WBCs… | Creatinine… | Uric.acid | |
| Survival | 1 | |||||||
| ALC | 0.311 | 1 | ||||||
| NLR | -0.386 | -0.57 | 1 | |||||
| LDH | -0.78 | -0.271 | 0.336 | 1 | ||||
| Glucose | -0.37 | -0.419 | 0.399 | 0.131 | 1 | |||
| IN/WBCs | -0.329 | -0.188 | 0.129 | 0.146 | 0.14 | 1 | ||
| Creatinine… | 0.679 | -0.036 | -0.102 | -0.495 | -0.182 | -0.569 | 1 | |
| Uric acid | -0.214 | -0.014 | -0.131 | -0.111 | 0.011 | 0.07 | -0.124 | 1 |
| A/G ratio | 0.462 | 0.254 | -0.301 | -0.117 | -0.031 | -0.26 | 0.452 | 0.06 |
| Albumin | 0.506 | 0.405 | -0.646 | -0.302 | -0.216 | -0.328 | 0.293 | 0.282 |
Several blood chemistry parameters correlated with patient survival time. LDH showed a negative correlation with survival (rs = -0.78), while creatinine (rs = 0.68) and albumin levels (rs = 0.51), along with the A:G ratio (rs = 0.46), showed strong positive correlations with survival. There was “weak” negative association between survival, NLR, immature neutrophils, glucose (rs in range -0.33÷-0.39) and positive association with ALC (rs= 0.31).
Univariate regression analysis indicated significant associations between survival and LDH (p < 0.04), creatinine (p < 0.006), albumin to globulin ratio (p<0.006) and albumin (p<0.02). The other variables showing correlation with survival, albeit at not quite 95% confidence level, included ALC (p = 0.16), NLR (p = 0 .13), glucose concentration (p = 0.13), and IN/WBC (p = 0.22).
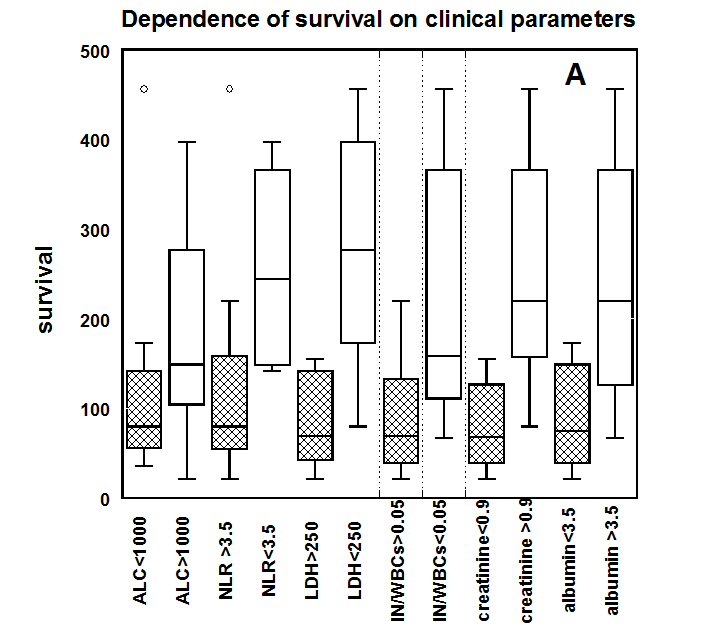
To demonstrate the prognostic value of these parameters, we compared survival times of subjects with normal parameter values to those with parameter values outside the normal range. Results are shown as box and whisker plots in Figure 2A. For each of the parameters depicted, subjects with values in the normal range had significantly better survival rates than those with abnormal parameter values. Survival times were reduced for subjects with ALC below 1000 cells/L, NLR above 3.5, LDH above 250 U/L, IN/WBC above 0.05, creatinine concentrations below 0.8 mg/dL, and albumin levels below 3.5 g/dL.
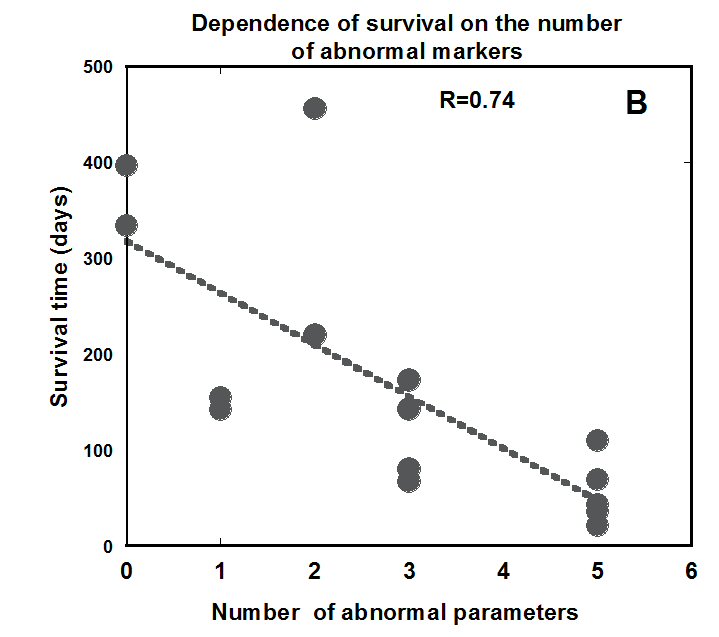
Figure 2B shows the cumulative effect of multiple abnormal parameter values. Survival time is plotted against the number of blood parameters plotted in Figure 2A that were in the abnormal range for each subject. For all but one subject, there is a strong correlation: survival time is lower for subjects with more abnormal values of the parameters ALC, NLR, LDH, IN/WBC, creatinine, or albumin. The exception was subject 2, who survived 453 days despite starting treatment with low ALC and elevated NLR. Her ALC returned to normal during treatment, and her NLR reduced from 6.5 to 4.5 during treatment.
Based on this analysis, we investigated the effect of the continuous IVC treatment parameters correlated with survival.
Figure 2(a) Survival time (days) of colon cancer patients with normal (clear boxes) or abnormal (shaded boxes) blood chemistry parameter values. Normal vs. Abnormal cutoffs: ALC < 1000 cells/ul, NLR < 3.5, LDH < 250 U/L, IN/WBC < 5%, creatinine < 0.8 mg/dl, and albumin < 3.5 g/dl
.
Figure 2(b) Survival time for each subject plotted against the number of parameters (see Figure 2A) outside normal range.
Effect of continuous infusion on absolute lymphocyte and neutrophil counts and neutrophil to lymphocyte ratio
As lymphocytes and neutrophils have important roles in tumorigenesis and carcinogenesis, we tracked the ALC and NLR during intravenous ascorbate infusions. In chemotherapy, neutrophil and lymphocyte counts typically decrease, with the effect being more severe for lymphocytes. Higher NLR values indicate lower survival times (An et al., 2010).
The effect of continuous infusions on the absolute lymphocyte count (ALC) was analyzed for all 17 terminally ill colon cancer patients. Ten patients enrolled in the study had lymphopenia or absolute lymphocyte counts less than 1300 cells/µl (normal range 1300-4000 cells/µl) with severe lymphopenia (ALC < 1000) observed in seven subjects. Six of the seven with severe lymphopenia saw improvement in ALC during ascorbate therapy (at an average increase of 53%).
The data of the patients’ lymphocytes one week before treatments, at the beginning and end of the treatment, and at the end of the treatment are shown in Table 3.
Table 3. Time course of ALC and NLR values in colon cancer patients given IVC infusions. ALCp = value 1 week pre-treatment; ALC0 = value at treatment start; ALCF = value at treatment end; NLRp= value 1 week pre-treatment; NLR0 = value at treatment start; NLR1 = value after 1 week treatment; and NLR4 = values averaged over 4 weeks treatment. ” ↓” marks NLR decrease during treatment.
| ………………. | ALCP | ALC0 | ALCF | NLRP | NLR0 | NLR1 | NLR4 | Trend |
| Subject 1 | 1230 | 980 | 1056 | 4.73 | 5.64 | 5.00 | 6.22 ± 0.87 | |
| Subject 2 | 1512 | 972 | 1055 | 3.19 | 6.50 | 4.29 | 4.54 ± 0.36 | ↓ |
| Subject 3 | nd | 1261 | 755 | nd | 5.69 | 5.92 | 7.46 ± 1.09 | |
| Subject 4 | 1400 | 1590 | 1270.2 | 2.07 | 1.87 | 2.46 | 2.33 ± 0.12 | |
| Subject 5 | 2232 | 1971 | 1795.2 | 1.74 | 2.07 | 2.27 | 2.65 ± 0.33 | |
| Subject 6 | 420 | 518 | 897 | 13.67 | 12.29 | 6.23 | 6.23 | ↓ |
| Subject 7 | 1296 | 1560 | 1044 | 6.75 | 15.00 | 9.11 | nd | ↓ |
| Subject 8 | nd | 944 | 1751 | nd | 4.56 | nd | 5.86 ± 0.55 | |
| Subject 9 | 1850 | 1494 | 3843 | 2.48 | 3.89 | nd | 2.94 ± 0.42 | ↓ |
| Subject 10 | 4712 | 4712 | 7752 | 2.30 | 2.00 | 1.84 | 2.12 ± 0.39 | |
| Subject 11 | 2048 | 2205 | 1610 | 2.00 | 1.00 | 1.88 | 2.31 ± 0.48 | |
| Subject 12 | nd | 936 | 915 | nd | 3.67 | 2.33 | 3.86 ± 0.89 | |
| Subject 13 | 2162 | 1168 | 1584 | 2.74 | 4.31 | 2.95 | 2.71 ± 0.40 | ↓ |
| Subject 14 | 1045 | 1188 | 572.5 | 3.68 | 3.32 | 3.85 | 5.05 ± 0.61 | |
| Subject 15 | 1178 | 1311 | 1605 | 4.05 | 3.84 | 3.74 | 3.27 ± 0.25 | ↓ |
| Subject 16 | 496 | 624 | 1075.2 | nd | 3.84 | nd | 3.94 | |
| Subject 17 | 1170 | 902 | 2058 | 4.80 | 6.91 | 2.95 | 4.51 ± 0.52 | ↓ |
The percentage of change in ALC was calculated based on the pre-treatment ALC (6-12 days before intervention), initial ALC values and the ALC at the end of the treatment. The average improvement of ALC during treatment was 28% (IQR: -20% ÷ 73%) in comparison with a decrease by an average of -10% (IQR: -25%÷ 13%) in the week immediately before treatment. Distributions of the percent change of ALC before and after treatment are shown in Figure 3.
Figure 3. Percent change in ALC and NLR before treatment compared to during IVC therapy in colon cancer patients who began treatment with abnormal values in each parameter.
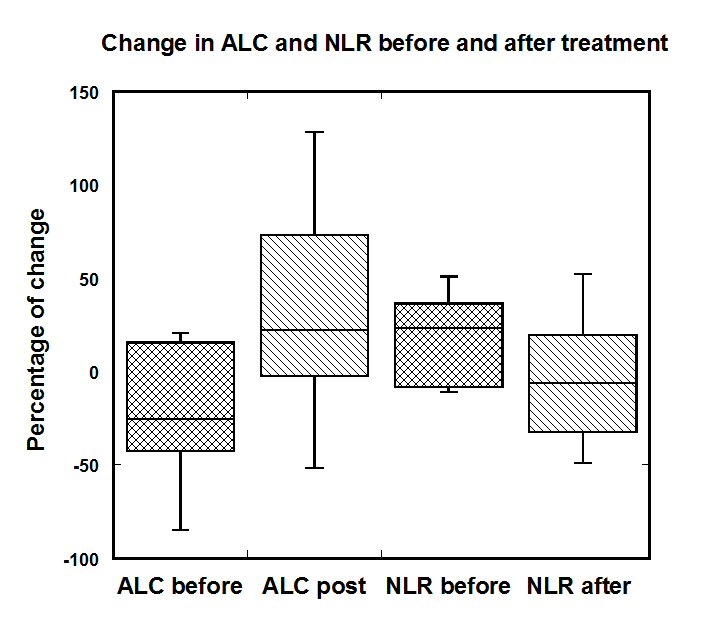
Data in Figure 3 indicate that values appear to drop in the week leading up to treatments, but improved during the course of treatment. This is a positive sign in light of the positive correlation between ALC and survival shown in Table 2.
Absolute neutrophil counts for most of the patients before intervention were in normal range (2000-7000 cell/ul), with exception of the elevated values for four patients (7180-9400 cells/ul). Two patients with elevated ANC have seen decrease in ANC and for two others ANC stayed at the level 9500-9900 cells/ul.
In addition, we evaluated the change in the level of immature granulocytes during intervention. Manual counts of immature neutrophils were obtained to allow evaluation of infection and the effect of treatment on inflammation. In our study we calculated the ratio of immature neutrophils to total white blood cells (WBCs). The level of immature granulocytes is considered high, when patients have more than 2% immature granulocytes in white blood cell count. The ratio of immature neutrophils to total white blood cells (IN/WBC) was above normal in ten patients, with the median value in these subjects being 7.5% (IQR = 4.9% to 12.6%). Treatment reduced these values to a median of 3.4% (IQR = 0.4% to 4.6%).
In addition, we calculated the neutrophil-to-lymphocyte (NLR) ratios, as NLR is useful prognostic factors in a variety of cancers. The values of NLR were defined from neutrophil and lymphocyte measurements one week before treatment, at the beginning of the treatment, one week after intervention and averages values for four weeks of treatment. Table 3 shows the NLRs for each of the seventeen subjects.
For NLR, values appear to be rising in the week leading up to therapy, suggesting a poor prognosis for these subjects. Initially, IVC decreased NLR, a positive sign in light of the negative correlation between NLC and survival shown in Table 2. Immediately prior to the onset of IVC therapy, 12 subjects had above normal NLR levels (0.78 – 3.53). The improvement in the NLR during treatment is shown as down marks (DN) in the Table 3. Continuous ascorbate infusion resulted in improvement of NLR in seven of the 12 patients who showed abnormal NLR values initially. For other subjects, NLR increased during as treatment time increased, however, though the final NLC values tended to be no worse than the initial values. This suggests that NLC could be stabilized to some extent by IVC.
The percentage of NLR change for patients with NLR higher than normal range was calculated before and after 4 weeks of treatment. The changes in ALC and NLR for each subject in the week prior to therapy (ALC-1 – ALC0 and NLC-1 – NLC0) were compared to the changes during treatment (ALCF – ALC0 and NLC4 – NLC0) are shown in Figure 3 for subjects who started treatment with abnormal levels of each parameter. For these subjects, IVC therapy tended to move parameter values in the right direction for improving prognosis, changing decreases in ALC to increases, and changing increases in NLR to decreases.
These data suggest that continuous ascorbate treatment can result in the suppression or prevention of the progression of the rate of growth of NLR.
Effect of ascorbate on blood chemistry parameters
LDH is elevated in many types of cancers; it has been linked to tumor growth, maintenance, and invasion (Suh et al., 2007). Regression analysis in the present study (Table 2) demonstrated a significant correlation between colon cancer patient survival time and LDH (P < 0.004). Subjects with LDH values within the normal range (140 to 280 U/L) had a median survival time of 277 days (IQR = 150 to 412) while subjects with elevated LDH values had a median survival time of 90 days (IQR = 44 to 143). LDH concentrations before IVC therapy were above the normal range in 56% of the patients. For all subjects, the median LDH was 340 U/L (IQR = 163 to 936) prior to therapy and 421 U/L (IQR = 164 to 856) after treatment. Overall, nine subjects showed continued increases in LDH while six showed an LDH decrease (one subject identical LDH levels pre and post treatment, and no data was available for one subject).
We compared the rate of change of LDH before and after intervention for six patients who had pre-treatment values of LDH available. For five patients in this group, the rate of growth defined (the weekly change in LDH) went down from a range of 8.0 to 30.0 U/L/week pre-treatment to a range of 3.7 to 4.5 U/L /week post-treatment.
Hyperglycemia is common in cancer patients. Sixty percent of the colon cancer patients in our study had above normal blood glucose concentrations (>100mg/dl). The effect of IVC on plasma glucose concentration is shown in Figure 4, where the average percent change in glucose concentration from the pre-treatment value is plotted against the initial glucose concentration.
Figure 4. Percentage of plasma glucose concentration change during IVC therapy as function of pre-treatment glucose concentrations (mg/dL). The line represents the linear extrapolation of the data.
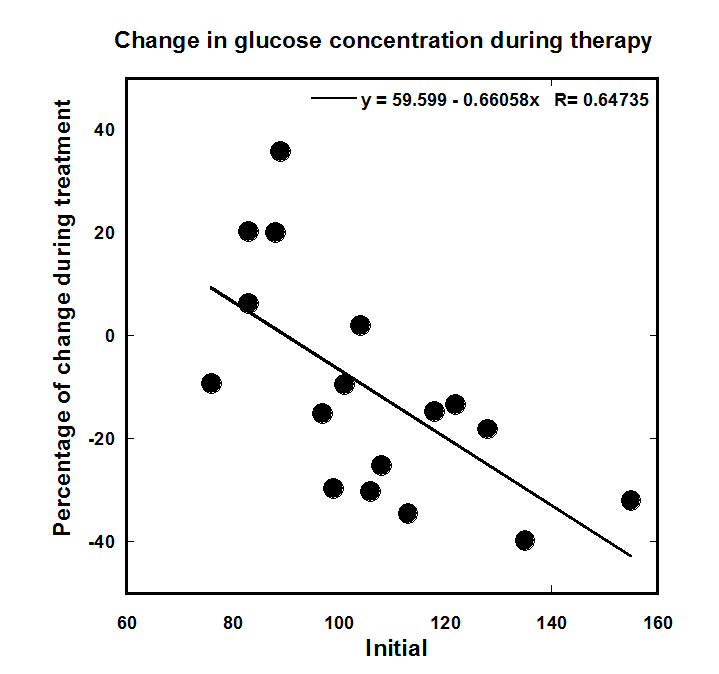
Patients with elevated initial glucose levels tended to see their glucose concentrations decrease during treatment, while those with initial levels below 90 mg/dL saw increases during treatment. For patients with above-normal pre-treatment glucose concentrations, plasma glucose concentrations decreased by an average of 21% (IQR = -31% to +13%) during treatment. The most dramatic decreases in glucose levels occurred when the initial glucose concentrations were at their highest. Hypoglycemia was not an issue for most patients. Four subjects with initial level of glucose 83 mg/dL to 108mg/dL saw glucose concentrations dip to levels of 47 – 65 mg/dl on days 9 and 16; these dips were corrected to normal levels by physician intervention. A fifth patient initial at 87 mg/dl glucose developed hypoglycemia (56 mg/dL) on day 59.
IVC treatments corresponded to significant reductions in serum uric acid (UA), noticeable as early as the first week after treatment. Recent evidence has demonstrated that elevated serum uric acid (hyperuricemia) is associated with excess cancer risk, recurrence, and mortality (Dovell et al., 2018; Strasak et al., 2007). Although uric acid can function as a systemic antioxidant, its pro-inflammatory properties have been postulated to play an important role in the pathogenesis of cancer. During treatment all patients experienced a significant uric acid lowering effect. The median values of UA were 5.1 mg/dL (IQR = 4.3 to 5.7) before treatment and 2.2 mg/dL (IQR = 1.4 to 2.7) after one week of treatment. The reduction of UA after one week of treatment depended on the dosage of the AA and was in the range 30-45% for low dosage 150 mg/kg/day to 60-80% for the highest dosage 710 mg/kg/day.
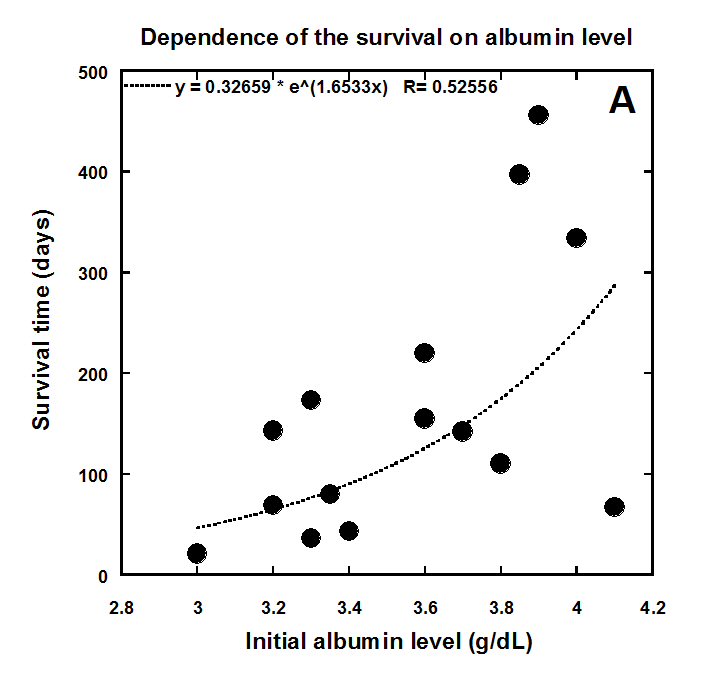
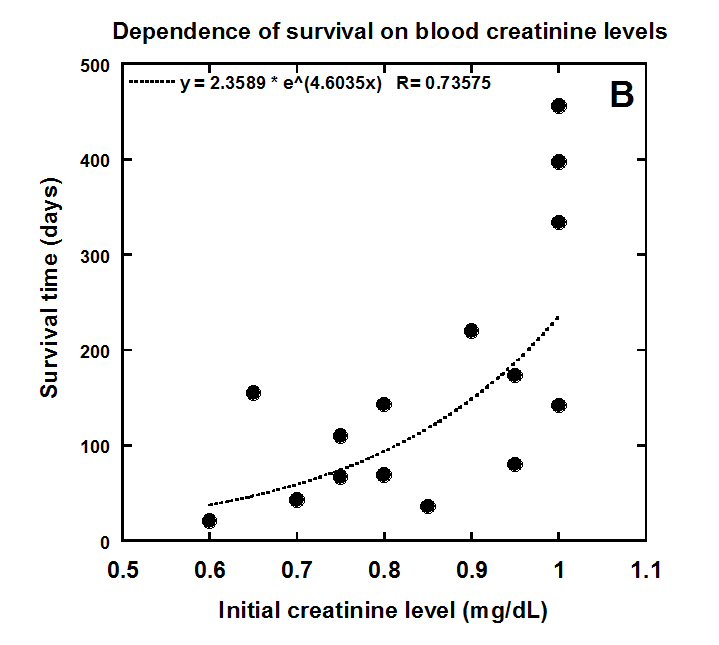
Two other blood chemistry parameters that correlate with survival in our study were serum albumin and creatinine. Serum albumin is generally used to assess the nutritional status, severity of disease, disease progression and prognosis. Creatinine is a metabolite of L-carnitine, which plays a central role in the metabolism of fatty acids. Low serum creatinine and carnitine levels are associated with the muscle wasting in cancer patients and is particularly severe in patients with colon and pancreatic cancers. Our data demonstrated high correlations between carnitine levels and survival colon cancer patients (r=0.679, p<0.006). The correlation of initial (pre-treatment) creatinine and albumin levels with survival time is shown in Figure 5(a, b).
Figure 5(a) Correlation of colon cancer patient survival with initial levels of albumin and creatinine.
.
Figure 5(b) Correlation of colon cancer patient survival with initial levels of albumin and creatinine.
Albumin was below normal range (3.5 to 5.0 g/dL) in 7 patients (median = 3.3 g/dL, IQR = 3.2 to 3.4). In 10 patients with albumin levels within the normal range, the median value was 3.9 g/dL (IQR = 3.7 to 4.1g/dL). As it was shown in Table 2 and Figure 2 albumin has a prognostic value of in our colorectal cancer patients. The relationship between albumin levels and survival evaluated by Spearman correlation coefficient was 0.5 and p-value <0.02. The correlation of initial value of albumin with the survival of patients is shown in Figure 5A.
During IVC therapy, albumin levels decreased in the below normal group by roughly 4.6 % on average. In the group with initial albumin in normal range, the decrease was, on average, 8.3%. Albumin levels were also decreasing in most of these subjects prior to therapy. The median values of the change in albumin were -5.64% (IQR:-6.6÷-0.64) before treatment and -4.2% (IQR:-9.1÷+0.22) for average values during treatment. Wicoxon signed-rank test indicated that the difference in these rates of change were not statistically significant (p<0.8). In summary, we do not have evidence that IVC affected albumin levels in this study.
Creatinine concentrations averaged 0.85 mg/dL (IQR = 0.75 to 0.98 mg/dl) before intervention and 0.72 mg/dL (IQR = 0.64 to 0.85 mg/dL) during intervention. The average decrease in creatinine during treatment was 14% (IQR = -4% to -24%), a statistically significant change (p<0.001). Thus, intervention did not prevent decreases in creatinine during this study.
Discussion
We analyzed data of seventeen colon cancer patients from the Phase I clinical trial given continuous IVC infusions. The eight-week trial involved terminal patients with poor prognosis: its primary aim was to assess risks and determine safety of continuous ascorbate injections. Considering recent interest in potential biological effects of vitamin C on cancer survival and improvements in quality of live, we analyzed previously unpublished data from this study concerning blood count and blood chemistry parameters in the subgroup of colon cancer patients in this study. Our purpose was two-fold: to see if these parameters served as prognostic indicators of survival for colon cancer patients in the study, and to determine there were any improvements in parameter values for these subjects during IVC therapy. Most practitioners using IVC to treat cancer administer it by bolus IV infusion at doses of 15 to 100 grams given over a one-hour period, with the goal of reaching roughly 20 mM plasma concentrations peaks. The Riordan clinical trial, in contrast, used continuous infusions, with doses starting at 10 grams per day. As shown in Figure 1 above, treatment of patients by continuous IVC increased the level of plasma vitamin C to the order of 1 mM, with the leveling concentration of AA in plasma after first or second day of treatment and without significant dependence of plasma AA on the dosages of infusion. At millimolar concentrations, ascorbic acid has been shown to have pro-oxidant properties, to be selectively toxic to tumor cells, and to correlate with decreased tumor growth in vivo (Casciari et al., 2005). Maintenance of these plasma ascorbic acid levels can likely replenish depleted tissue AA stores and stimulate anti-tumor activity through multifunctional mechanisms of action, such as stimulation of the 2-oxoglutarate dependent dioxygenase family of enzymes, which regulate the hypoxic response and collagen stabilization, and the epigenetic histone and DNA demethylation (Young et al., 2015; Kuiper et al., 2014). There are studies supporting the anti-tumor effect of AA at concentrations below the pharmacological plasma peaks observed in bolus IVC. For example, ascorbic acid can inhibit hypoxia-inducible factor-1 (HIF-1) activation at dose 1–3 mM (Myllyla et al., 1978). Analysis of ascorbic acid as a cofactor for hydroxylases that regulate gene transcription and cell signaling pathways shows that AA concentrations much less than 1 mM cause dose-dependently increases in the 5-hmC signal (Minor et al., 2013). In summary, the continuous infusion of IVC at doses used in this pilot clinical trial (10 – 50 g/day) lead to sustained plasma AA concentrations (1.0 to 1.6 mM) that, based on substantial experimental evidence, are likely sufficient for anti-tumor effects.
In the present study, we evaluated the initial blood chemistry parameters as prognostic factors of patients’ survival. According to our data the strong correlation with survival was found for LDH, creatinine and albumin levels. The other variables that showed weaker correlation with survival included ALC, NLR, glucose, and IN/WBC. Our data show the cumulative effect of multiple abnormal parameter value.
The above results of the prognostic value of hypoalbuminemia in colorectal cancer is consistent with previous studies, and serum albumin level has been found to be an independent prognostic factor for survival in various cancers including colorectal cancer (Heys et al., 1998). In cancer patients, serum albumin continues to be used clinically to assess nutritional status, severity of the disease, disease progression, and prognosis (Narsha et al., 2015). Association of lower albumin or albumin-to-globulin ratios with poorer survival are also in favor of a tilt towards proinflammatory states as the cause of morbidity and mortality. Basic and clinical research results suggest that hypoalbuminemia, malnutrition and cancer cachexia are all consequences of the body’s systemic inflammatory response to the malignancy. In our group of patients, seven patients had level of albumin lower than normal range with tendency to decrease on average on 8.3% during intervention.
Creatinine was found to be another prognostic parameter of survival for late stage colon cancer patients (r=0.68, p<0.006). Low serum carnitine levels have been suggested to play an important contributory role in the development of cachexia, a paraneoplastic syndrome presented in 80% of terminally ill patients and markedly associated with adverse prognosis and shortened survival time (Davis et al., 2000). Our patients had 14% average decrease in the creatinine levels during treatment.
Another potential biomarker of patients’ survival was the level of lactate dehydrogenase (r=-0.78). Concentrations of lactate dehydrogenase, an enzyme that catalyzes the conversion of pyruvate to lactate and is thus considered as a key checkpoint of anaerobic glycolysis, are elevated in many types of cancers. LDH has been linked to tumor growth, maintenance, and invasion (Suh et al., 2007). The significance of the LDH as a prognostic factor for survival time of terminally ill cancer patients was demonstrated earlier (Miao et al., 2013). Only six patients showed the decrease in the level of LDH during treatment; however, the rate of growth of this parameter in patients with LDH higher than normal range was decreased in most of patients.
Analysis of white blood cell counts for colon patients in our trial provided two main observations: patient lymphocytes tended to decrease with time prior to therapy; and patients who had below normal lymphocyte counts at the onset of therapy tended to see an increase in lymphocyte numbers during IVC treatment. The average improvement of ALC was 28% (IQR: -20% ÷ 73%) after treatment in comparison with the average decrease of -10% (IQR: -25%÷ 13%) before treatment. Severe lymphopenia was measured in seven patients before intervention with average 53% improvement after treatment. The present analysis demonstrated the regulatory effect of continuous IVC on ALC and lymphopenia and suggested a strategic benefit of using medium IVC doses in continuous infusions for improvement immune cell counts.
Analysis of neutrophil-to-lymphocyte ratios also demonstrated a potentially beneficial regulatory effect of continuous IVC on the immune cell population. NLR has been used to assess inflammatory response. In the present study, most of the patients entered the trial with above normal NLRs. Continuous IVC therapy decreased NLR in seven of 12 patients who had initially above-normal NLR levels.
In addition, our analysis also demonstrated an effect of continuous IVC on immature granulocytes. In our study 60% of the patients had elevated IN/WBCs (averaged for the period before treatment) with a median of 7.5%. During treatment, the average value of immature neutrophils decreased to 3.5%.
There was significant decrease in plasma concentration of uric acid (median 2.2 mg/dl) after the first week of treatment and this level approximately maintained throughout treatment. Elevated serum uric acid is associated with excess cancer risk, recurrence, and mortality; moreover, high serum uric acid may be a valuable long-term surrogate parameter, indicative for a lifestyle at increased risk for the development of cancer (Dovell et al., 2018). If the ability of IVC to decrease UA proves to be a general phenomenon, then treatment by continuous ascorbate infusions may be beneficial in treating other conditions characterized by high levels of UA, such as hypertension, metabolic syndrome, renal disease, and cardiovascular disease. Elevated serum uric acid is a marker of chronic inflammation, and excess uric acid can become crystallized in joints and kidneys, leading to gout and kidney stones. The mechanisms by which ascorbate reduces serum uric acid might include increased glomerular filtration and/or competition for renal reabsorption, i.e., vitamin C and uric acid are both reabsorbed via anion exchange.
Our data confirm that continuous IVC can be administered safely. For prevention of hypokalemia the level of electrolytes should be controlled during treatment and include supplementation (especially potassium). Glucose levels should be monitored to exclude the development of hypoglycemia for patients with initially low serum glucose concentrations. In addition, renal function should be monitored and patients with the history of kidney disease are not recommended for such treatments. Other side effects were minor. Adverse events were more frequent at the higher IVC doses used (Mikirova et al., 2019), and based on the pharmacokinetic data, we can suggest that higher doses may result in more side effects without significant increasing plasma ascorbate concentrations and improvement biomarkers beyond those obtained at lower doses.
This analysis, to our knowledge, is the first clinical study of continuous IVC infusion that includes analysis of biological markers correlating with survival and monitors how these markers change during therapy. We conclude that doses between 10 – 20 g/day are enough to achieve plasma ascorbate concentrations of 1 mM or higher. IVC therapy also showed signs of improving blood count and chemistry parameters that are prognostic indicators of patient survival, including ALC, NLR, and IN/WBC. IVC therapy was also associated with decreases in serum glucose and uric acid concentrations.
The use of continuous infusion IVC therapy in colon cancer patients thus warrants further study.
The weaknesses of the study were low number of patients, late stage of cancer (untreatable, metastatic colon cancer), the lack of a control group, and the likelihood that subjects had immune systems that were damaged by prior treatments such as chemotherapy and irradiation. Future studies should be designed to address these issues.
Conclusions
In conclusion, the analysis of the parameters that served as prognostic indicators of colon cancer patients’ survival and evaluation of the improvements of described parameters’ values for these subjects during IVC therapy demonstrated that continuous IVC infusions have benefit for colon cancer patients. Continuous ascorbic acid infusions showed the regulatory effect on absolute lymphocyte counts, lymphopenia, neutrophil to lymphocyte ratio, level of immature neutrophils, rate of growth of lactate dehydrogenase in patients with elevated initial levels and hyperglycemia. The data suggested a strategic benefit of using dosages of ascorbic acid at less than intermittent high dose injections and regimen of continuous infusions for improving immune functioning and cancer biomarkers. In addition, our analysis demonstrated that continuous IVC can be administered safely.
Acknowledgments
Author grateful to Dr. Casciari for help in writing and editing manuscript.
Disclosure Statement
No competing financial interests exist.
References
Aguilera O, Muñoz-Sagastibelza M, Torrejón B, et al. (2016) Vitamin C uncouples the Warburg metabolic switch in KRAS mutant colon cancer. Oncotarget. 7:47954-47965. https://doi.org/10.18632/oncotarget.10087
Allen WL, Coyle VM, Johnston PG (2006) Predicting the outcome of chemotherapy for colorectal cancer. Curr. Opin. 6: 332-336. https://doi.org/10.1016/j.coph.2006.02.005
An SH, Kang JH, Kim DH, Lee MS (2011) Vitamin C increases the apoptosis via up-regulation p53 during cisplatin treatment in human colon cancer cell. BMB Reports, 44.3. 211. https://doi.org/10.5483/BMBRep.2011.44.3.211
An X, Ding PR, Wang FH, et al. (2010) Elevated neutrophil to lymphocyte ratio predicts survival in advanced pancreatic cancer. Biomarkers. 15: 516–522. https://doi.org/10.3109/1354750X.2010.491557
Blanchard J, Tozer TN, Rowland M (1997) Pharmacokinetic perspectives on mega doses of ascorbic acid. Am J Clin Nutr. 66: 1165-71. https://doi.org/10.1093/ajcn/66.5.1165
Campbell EJ, Vissers MCM, Wohlrab C, et al. (2016) Pharmacokinetic and anti-cancer properties of high dose ascorbate in solid tumors of ascorbate-dependent mice. Free Radical Biology and Medicine. 99: 151-462. https://doi.org/10.1016/j.freeradbiomed.2016.08.027
Casciari J, Riordan H, Miranfa-Massari J, Gonzalez M (2005) Effects of high dose ascorbate administration on L-10 tumor growth in guinea pigs. Puero Rico Health Sciences Journal. 24(2):145-150
Chen Q, Espey MG, Krishna MC, et al. (2005) Pharmacologic ascorbic acid concentrations selectively kill cancer cells: Action as a pro-drug to deliver hydrogen peroxide to tissues. Proc Natl Acad Sci USA. 102:13604–13609. https://doi.org/10.1073/pnas.0506390102
Davis MP, Dickerson D (2000) Cachexia and anorexia: cancer’s covert killer. Support Care Cancer. 8:180–187. https://doi.org/10.1007/s005200050282
Dovell F, Boffetta P (2018) Serum uric acid and cancer mortality and incidence: a systematic review and meta-analysis. Eur J Cancer Prev. 27(4):399-405. https://doi.org/10.1097/CEJ.0000000000000440
Dua J, Cullena JJ, Buettnera GR (2012) Ascorbic acid: Chemistry, biology and the treatment of cancer. Biochim Biophys Acta. 1826: 443-457. https://doi.org/10.1016/j.bbcan.2012.06.003
Duarte TL, Almeida GM, Jones GD (2007) Investigation of the role of extracellular H2O2 and transition metal ions in the genotoxic action of ascorbic acid in cell culture models. Toxicol Lett. 170: 57–65. https://doi.org/10.1016/j.toxlet.2007.02.005
Halabi I, Bejjany R, Nasr R, et al. (2018) Ascorbic acid in colon cancer: From the basic to the clinical applications. Int. J. Mol. Sci. 19: 2752. https://doi.org/10.3390/ijms19092752
Heys SD, Walker LG, Deehan DJ, Eremin OE (1998) Serum albumin: A prognostic indicator in patients with colorectal cancer. J R Coll Surg Edinb. 43: 163-168
Kim JE, Kang JS, Lee WJ (2012) Vitamin C induces apoptosis in human colon cancer cell line, HCT-8 via the modulation of calcium influx in endoplasmic reticulum and the dissociation of bad from 14-3-3beta. Immune Netw. 12: 189–195. https://doi.org/10.4110/in.2012.12.5.189
Kuiper C, Dachs GU, Currie MJ, Vissers MC (2014) Intracellular ascorbate enhances hypoxia-inducible factor (HIF)-hydroxylase activity and preferentially suppresses the HIF-1 transcriptional response. Free Radic. Biol. Med. 69: 308–317. https://doi.org/10.1016/j.freeradbiomed.2014.01.033
Kuiper C, Dachs GU, Munn D, et al. (2014) Increased tumor ascorbate is associated with extended disease-free survival and decreased hypoxia inducible factor-1 activation in human colorectal cancer. Front Oncol. 4: 10. https://doi.org/10.3389/fonc.2014.00010
Lievre A, Bachet JB, Le Corre D, et al. (2006) Kras mutation status is predictive of response to cetuximab therapy in colorectal cancer. Cancer Res. 66: 3992–3995. https://doi.org/10.1158/0008-5472.CAN-06-0191
Miao P, Sheng S, Sun X, Liu J, Huang G (2013) Lactate Dehydrogenase A in Cancer: A Promising Target for Diagnosis and Therapy. International Union of Biochemistry and Molecular Biology. 65:904– 910. https://doi.org/10.1002/iub.1216
Mikirova N, Casciari J, Hunninghake R (2019) Continuous intravenous vitamin C in the cancer treatment: reevaluation of a Phase I clinical study. Functional Foods in Health and Disease. 9(3): 180-204.
Minor EA, Court BL, Young JI, Wang G (2013) Ascorbate induces ten eleven translocation (Tet) methylcytosine dioxygenase-mediated generation of 5-hydroxymethylcytosine. J Bio Chem. 288: 13669-13674. https://doi.org/10.1074/jbc.C113.464800
Myllyla R, Kuutti-Savolainen ER, Kivirikko KI (1978) The role of an ascorbate in the prolyl hydroxylase reaction. Biochem Biophys Res Commun. 83: 441-448. https://doi.org/10.1016/0006-291X(78)91010-0
Nazha B, Moussaly E, Zaarour M, et al. (2015) Hypoalbuminemia in colorectal cancer prognosis: Nutritional marker or inflammatory surrogate? World J Gastrointest Surg. 7(12): 370-377. http://dx.doi.org/10.4240/wjgs.v7.i12.370
Pathi SS, Lei P, Sreevalsan S, et al. (2011) Pharmacological doses of ascorbic acid repress specificity protein (Sp) transcriptional factors and Sp-regulated genes in colon cancer cells. Nutr Cancer. 63(7): 1133–1142. https://doi.org/10.1080/01635581.2011.605984
Pires AS, Marques CR, Encarnação JC, Abrantes AM, Mamede AC, Laranjo M, Gonçalves AC, Sarmento Ribeiro AB, Botelho MF (2016) Ascorbic acid and colon cancer: An oxidative stimulus to cell death depending on cell profile. Eur J cell Bio. 95: 208-218. https://doi.org/10.1016/j.ejcb.2016.04.001
Riordan HD, Casciari JJ, Gonzalez MJ, et al. (2005) A pilot clinical study of continuous intravenous ascorbate in terminal cancer patients. PR Health Sci J. 24: 269-276.
Ryu TY, Jiyoung Park J, Scherer PE (2014) Hyperglycemia as a risk factor for cancer progression. Diabetes Metab J. 38:330-336. https://doi.org/10.4093/dmj.2014.38.5.330
Shi Y (2007) Histone lysine demethylases: Emerging roles in development, physiology and disease. Nat Rev Genet. 8: 829-833. https://doi.org/10.1038/nrg2218
Starczak M, Zarakowska E, Modrzejewska M, et al. (2018) In vivo evidence of ascorbate involvement in the generation of epigenetic DNA modifications in leukocytes from patients with colorectal carcinoma, benign adenoma and inflammatory bowel disease. J Transl Med. 16:204. https://doi.org/10.1186/s12967-018-1581-9
Strasak AM, Rapp K, Hilbe W, et al. (2007) Serum uric acid and risk of cancer mortality in a large prospective male cohort. Cancer Causes Control. 18(9):1021-9. https://doi.org/10.1007/s10552-007-9043-3
Suh SY, Ahn HY (2007) Lactate dehydrogenase as a prognostic factor for survival time of terminally ill cancer patients: A preliminary study. Eur. J Cancer. 43: 1051–1059. https://doi.org/10.1016/j.ejca.2007.01.031
Tan C, Du X. (2012) KRAS mutation testing in metastatic colorectal cancer. World J. Gastroenterol. 18:5171.
Young JI, Zuchner S, Wang G (2015) Regulation of the epigenome by Vitamin C. Annu Rev Nutr. 17:35: 545-564. https://doi.org/10.1146/annurev-nutr-071714-034228
Yun J, Mullarky E, Lu C, et al. (2015) Vitamin C selectively kills KRAS and BRAF mutant colorectal cancer cells by targeting GADPH. Science. 350: 1391–1396. https://doi.org/10.1126/science.aaa5004